Tag Archives: WinDbg

WinDbg: Custom workspace and color scheme

WinDbg is a great debugging tool but it comes with very simple and minimalist workspace and color scheme.

This paper outlines main steps and techniques used to customize WinDbg. I also provide a configuration file of my debugging environment.

Workspaces Customization

WinDbg stores theme settings in a registry key located under HKCU\Software\Microsoft\Windbg\Workspaces. Importing a new theme is as simple as overwriting this registry key using an appropriate .reg file. Deleting this key will clear all of your workspace data.

The themes subdirectory where the WinDbg is installed contains several themes stored as .reg files. There is a also a themes.doc file that describes loading workspaces as well as providing screenshots of the provided workspaces.

Steps required to customize a workspace:

– Backup HKCU\Software\Microsoft\Windbg\Workspaces key in case you need to revert your changes.

– Clear all of your workspace data by deleting the previous registry key or import a theme (such themes/standard.reg) to start setting things up.

– Start WinDbg with no command-line parameters. This will open the default workspace.

– Tweak your theme:

  • Add all the windows you wish to see (Command, Calls, Watch, Locals, Registers …) and adjust their positioning.
  • To change the font, choose Font… from the View menu.
  • To change the syntax colors, choose Options… from the View menu. Then, in the Colors area, select a syntax element and click the Change button to change the color.
  • Optionally set paths (symbol path, source path, executable image path …) to make sure that WinDbg can locate all of the files that it needs to debug effectively.

– Open File menu then select Save Workspace then exit WinDbg.  Answer yes to “save information for workspace ?”. The newly created workspace will now be remembered as your default workspace.

– Export HKCU\Software\Microsoft\Windbg\Workspaces to a .reg file in order to share or backup your workspaces.

My settings

Below is my WinDbg debugging environment layout (light grey theme):


WinDbg_GreyTheme

You can download my registry key for this settings from WinDbg_GreyTheme_reg (rename to WinDbg_GreyTheme.reg after download). This registry key contains some path information that is specific to my machine (for instance, the placeholder window for the Source window) that will need to be updated once installed on your machine.

WinDbg: Some debugging commands

This article describes some WinDbg commands that can be used on daily basis.

Getting Help

– .help : Display a list of all meta-commands.
– .hh command : Open help file index for the specified command.
– ! [ExtensionDLL.]help : Display help text that describes the extension commands exported from ExtensionDLL or from the extension dll at the top of the chain.

Sources

– .srcpath : Display the source search path.
– .srcpath+ path : Append path to the current source file search path.

– .srcnoisy : Display the current status of noisy source loading.
– .srcnoisy {0 | 1 | 2 | 3} : control the verbosity level for source file loading.

– .cls : Clear the Debugger Command window display.

– lsf FileName : Load the source file FileName.
– lsf- : Unload the source file FileName.

– ls first, count : Display count lines starting from first line from the current source file.
– lsp Leading Trailing : Specify Leading and Trailing lines to show before and after the current line.

– lsc : Display the current source file name and line number.
– lse : Open an editor for the current source file.

– l+l / l-l : Show/turn of source line numbers at the command prompt.
– l+s / l-s : Display/hide source lines and source line numbers at the command prompt.
– l+t / l-t : Start source mode / set the debugger is in assembly mode.

– .lines [-e | -d | -t] : Toggle source-line information support [enable | disable | toggle].

Symbols

– x *! : List all modules.
– x module!* : List all symbols loaded from module.
– x /t /v module!* : List all symbol in module with data type, symbol type and size.
– x module!pattern* : show me all the symbols loaded from module that begin with pattern.
– x module!*pattern* : Finds all of the symbols in module that contain the string pattern.

– .sympath+ path : Add symbols located in path.
– !sym noisy : Activate noisy symbol loading.

– .reload /f driver.sys : Force the debugger to immediately reload symbols for driver.sys.
– .reload /u driver.sys : Unload driver.sys and all its symbols.

Loaded modules

– lm : Display all loaded and unloaded modules.
– lm f : List loaded modules with full path.
– lm t : List loaded modules with last modified timestamp.
– lm v m module : Display all possible information for module.

– !dlls -v -c ntdll : Display table entries and version information for ntdll.dll, including Loadcount.

– !lmi driver.sys : Display detailed information about driver.sys, including symbol information.
– !dh ndis : Display file headers for ndis.sys.

Processes

– |* : Print status of all processes being debugged.
– |. : Print status of the current process.

– .tlist : Lists all processes running on the system.
– !peb : Display formatted view of the process’s environment block (PEB).

– !process 0 0 : List all active processes with basic details.
– !process 0 7 process : Display full details for process.

Threads

– ~ : Display status for all threads in the current process.

– ~* k : Call stack for all threads.
– ~number n : Suspend thread whose ordinal is number.
– ~number m : Resume thread whose ordinal is number.
– ~number f : Freeze thread whose ordinal is number.
– ~number u : Unfreeze thread whose ordinal is number.
– ~number s : Switch to thread whose ordinal is number.

– ~# f : Freeze the thread causing the current exception.

– !thread : Display current thread on the target system.
– !thread -t ThreadID : Dump thread which ID is ThreadID.
– !ready : Display summary information about each thread in the system in a READY state.

– !analyse -v : Display verbose information about the current exception or bug check.
– !analyze -show BugCheckCode : Display information about BugCheckCode bug check code.

Breakpoints

– bl – List existing breakpoints. Each breakpoint listed has a number in the list.
– bc * : Clear all breakpoints.
– bc number : Clear breakpoint identified by number.
– be number : Enable breakpoint identified by number.
– bd number : Disable breakpoint identified by number.

– bp `module!source.c:20` : Set breakpoint at source.c line 20 in module.
– bm module!pattern* : Set a breakpoint on symbols starting with pattern in module.
– bu module!function : Set a breakpoint on function as soon as module is loaded.

– ba r4 variable : Set a breakpoint for read access on 4 bytes of variable.
– ba w4 address : Set a breakpoint for write access on 4 bytes at address.
– bp @@(class::method) : Break on method defined in class. Useful if the same method is overloaded and thus present on several addresses.

– bp module!function /1 : Trigger only once a breakpoint at function in module.
– bp module!function k : Hit breakpoint at function in module after k-1 passes.

– ba w4 address “k;g” : Display call stack every write access on 4 bytes at address.
– bu module!function “.dump C:\Dump.dmp; g” : Create a dump in C:\Dump.dmp every time breakpoint at function in module is hit.

– bp /t thread : Set a kernel mode breakpoint that only triggers when hit in the context of the associated thread.
– bp /p process : Set a kernel mode breakpoint that only triggers when hit in the context of the associated process.

-.logopen FilePath; .bpcmds; .logclose : Save breakpoints to FilePath.
– $<FilePath : Reload breakpoints from FilePath.

Tracing and stepping

– g : Start executing the given process or thread.
– g `:number`; ? poi(variable); g : Executes the current program to source line number, print the value of variable then resume execution.
– gc : Resume execution from a conditional breakpoint.
– gu : Execute until the current function is complete.
– gh : Go with Exception Handled.
– gn,: Go with Exception Not Handled.
– p : Step over.
– t : Step in.
– pr : Toggle displaying of registers.
– p count “kb” : Step through count source lines then execute “kb”.
– pc : Step to next CALL instruction.
– pt – Steps through until the next return instruction.
– pa address : Step until address is reached.
– wt : Trace and watch the execution flow of a function and its sub-functions.
– wt -l Depth -oR : Trace sub-functions to Depth and display their return values.

Call stack

– k : Display call stack.
– kn : Display call stack with frame numbers.
– kb : Display call stack with first three parameters passed to each function.
– kb FrameCount : Display first FrameCount frames only.
– kp : Display all of the parameters for each function that is called in the stack trace.
– kn : Display frame numbers.

– !findstack symbol 2 : Display all stacks that contain symbol.

– .frame : Show current frame.
– .frame FrameNumber : Set frame FrameNumber for the local context.
– .frame /r FrameNumber : Display registers in frame FrameNumber.

– !running -ti : Dump the stacks of each thread that is running on all processors.
– !stacks : Give a brief summary of the state of every thread.

Registers

– rm ? : Show possible Mask bits.
– rm 1 : Enable integer registers only.
– r : Display the integer registers.
– r eax, edx : Display only eax and edx.
– r eax=5, edx=6 : Assign new values to eax and edx.
– r eax:1ub : Display only the first byte from eax.
– rF : Display the floating-point register.

Variables

– dv /t /i /V : Dump local variables with type information, addresses and EBP offsets and classify them into categories.
– dt module!pattern* -v -s Length : List with verbose output all variables that begin with pattern in module that have Length bytes size.

– dt ntdll!_PEB : Dump _PEB structure.
– dt module!struct : Show fields of the structure struct defined in module with their offsets and types.
– dt module!struct -rCount : Dump fields of the structure struct defined in module recursively for Count levels.

– dt module!struct var. : Dump var defined in strcut in module and expand its subfields.
– dt module!struct var.. : Expand subfields of var defined in strcut in module for 2 levels.

Memory

– dd address : Display double-words at address.
– dd address LLength: Display Length double-words at address.
– du address : Display unicode chars at address.
– du address LLength : Display Length unicode chars at address.
– !mapped_file address : Display name of file that contains address.
– !address : Show all memory regions of our process.
– !address address : Retreive inforamation about a region of memory at address.

– eb address value : Set byte at address to value.
– ew address value : Set word at address to value.
– ed address value : Set double-word at address to value.

– ds /c width address : Display width chars at address.
– dS /c width address : Display width unicode chars at address.

– c address1 LLength address2 : Compare Length bytes at address1 with address2.
– m address1 LLength address2 : Move Length bytes at address1 to address2.
– f address LLength ‘A’ ‘B’ ‘C’ – Fill memory location from address to address + Length – 1 with the pattern “ABC”, repeated as many times as necessary.

– s -a address LLengthpattern” : Search memory location from address to address + Length – 1 for pattern.
– s -wa address LLength “pattern” : Search only writable memory from address to address + Length – 1 for pattern.

– !poolused : Display memory use summaries, based on the tag used for each pool allocation.
– !vm : Display summary information about virtual memory use statistics on the target system.

– u address : Unassemble code at address.

Heap

– dt ntdll!_HEAP : Dump _HEAP structure.
– !heap : List all heaps with index and Heap address.
– !heap -h : List all of the current process heap with start and end addresses.
– !heap -h HeapIndex : Display detailed heap information for heap with index HeapIndex.
– !heap -s 0 : Display summary for all heaps including reserved and committed memory …
– !heap -flt s 0x50 : Display all of the allocations of size 0x50.
– !heap -stat -h address : Display heap usage statistics for HeapHandle is equal to address.
– !heap -b alloc tag HeapIndex : Breakpoint in heap with index HeapIndex on HeapAlloc calls with TAG equal to tag.
– !heap -p -all : Display details of all allocations in all heaps in the process.
– !heap -l : Make the debugger detect leaked heap blocks.

Memory dump

– .dump FileName : Dump small memory image into FileName.
– .dump /ma FileName : Dump complete memory image into FileName.

Locks

– !locks : Display all kernel mode locks held on resources by threads.
– !qlocks : Display the state of all queued spin locks.

Extension DLLs

– .load ExtensionDLL : Load the extension DLL ExtensionDLL into the debugger.
– .unload ExtensionDLL : Unload the extension DLL ExtensionDLL.

– .chain : List all extensions that the debugger has loaded.
– .unloadall : Unload all extension DLLs from the debugger.
– .setdll ExtensionDLL : Change the default extension DLL to ExtensionDLL for the debugger

Application Verifier

– !avrf : Display a variety of output produced by Application Verifier. If a Stop has occurred, reveal the its nature and what caused it.
– !verifier 0xf : Display the status of Driver Verifier and its actions.
– !verifier 0x80 address : Display log associated with the specified address within the kernel pool Allocate and Free operations.
– !verifier 0x100 address : Display log associated with the IRP at address.

Windows driver debugging with WinDbg and VMWare

Virtualization Software such as VMware Workstation enables driver and kernel-mode code developers to speed up development, debugging and testing resulting in faster time to deployment. Snapshots provide a fast and easy way to revert the virtual machine to a previous state. This feature greatly simplifies recreation of specific states or conditions to troubleshoot problems and system crashes.

WinDbg is a debugging tool from Microsoft for user and kernel mode debugging. WinDbg is a GUI interface and a console interface along with some debugging extensions. Using virtual machines, WinDbg can be used to debug kernel code without the need for two physical computers.

This tutorial shows how to debug a simple Windows driver running inside a VMware virtual machine with WinDbg using a single physical machine. The following typical debugging scenarios are covered:

    • Debugging host’s virtual machine: WinDbg runs inside a physical computer to debug a virtual machine.
    • Debugging between two virtual machines: WinDbg runs inside a virtual machine to debug the second one.

Basic familiarity with device driver development and kernel debugging is assumed.

Prerequisites

The working folder is C:\Briolidz\Dev\BriolidzSampDrv.

I assume that your host and guests root system partition is C:\. The kernel debugging setup will use a virtual serial port on COM2 at 115200 bps. The custom named pipe is called BriolidzDbgPipe.

These parameters can be changed to fit your own setup.

VMware machine configuration

In the first debugging scenario, you will debug a virtual machine directly over a named pipe from the host operating system. In the second scenario, you will connect two virtual machines to the same named pipe by creating a virtual null-modem cable. The following configuration steps can be easily adapted for other virtualization software such as VirtualBox and Virtual PC.

In both scenarios, you need to setup the guest virtual machine to debug as follows:

1. Powered off the virtual machine.
2. Open VM then select Settings in VMware Workstation menu.
3. In the VMware Machine Settings dialog box, click Add.
4. In the Add Hardware Wizard dialog box, select Serial Port and click Next.
5. On next page, select Output to named pipe and click Next.
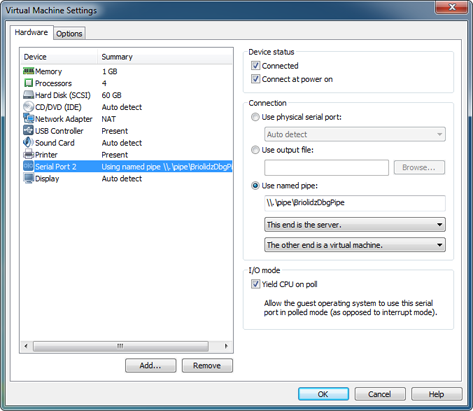
6. Set Name pipe to \\.\pipe\BriolidzDbgPipe. Make sure you select This end is the server and The other end is virtual machine. Check Connect at power on then click Finish.
7. After clicking Finish, select the newly created serial port and check Yield CPU on poll.

You should have something similar to the following screenshot. Note that new serial port has number 2 which corresponds to COM2. If you get assigned another number then make sure to replace COM2 with COM<your assigned number> in the Virtual machine configuration section.
Skip this step, if you are going to use WinDbg on your host (physical computer).

So you decided to use a second virtual machine as a development and debugging machine to replace the host physical machine. In this case, do:

1. Powered off the virtual machine.
2. Open VM then select Settings in VMware Workstation menu.
3. In the VMware Machine Settings dialog box, click Add.
4. In the Add Hardware Wizard dialog box, select Serial Port and click Next.
5. On next page, select Output to named pipe and click Next.
6. Set Name pipe to \\.\pipe\BriolidzDbgPipe. Make sure you select This end is the client and The other end is virtual machine. Check Connect at power on then click Finish.
7. After clicking Finish, select the newly created serial port and check Yield CPU on poll.

You should have something similar to the following screenshot. Note that the new serial port has number 2 which corresponds to COM2. As stated earlier, if you get assigned another number then replace COM2 with COM<your number> in the Attaching WinDBG Debugger section.

Virtual machine configuration

To enable kernel debugging, you need to change Windows boot parameters. Your virtual machine will also be configured to use serial debugging on COM2 at 115200 bps. Power on your virtual machine, log in then apply the following modifications according to your operating system version.

1. Windows XP

Windows XP uses a configuration file called boot.ini on the root of the system partition (generally the C:\ drive) to control how the operating system is booted and any startup options.

The boot.ini file has the Hidden, System, and Read-Only attributes set by default. Open a command prompt, and change them:

attrib -s -h -r C:\boot.ini

The boot.ini file is a standard ASCII text editor. Double click it to edit and duplicate the matching default entry defined in boot loader section, change its title by adding [DEBUG] for instance, add /Debug, /debugport=com2 and /baudrate=115200 switches. Below, a modified sample for Windows XP professional:

[boot loader]
timeout=30
default=multi(0)disk(0)rdisk(0)partition(1)\WINDOWS
[operating systems]
multi(0)disk(0)rdisk(0)partition(1)\WINDOWS="Microsoft Windows XP Professional [DEBUG]" /noexecute=optin /fastdetect /Debug /debugport=com2 /baudrate=115200
multi(0)disk(0)rdisk(0)partition(1)\WINDOWS="Microsoft Windows XP Professional" /noexecute=optin /fastdetect

You can reduce the timeout value in order to speed up booting.

Restore the Read-Only, Hidden, and System attributes of the boot.ini file, type the following at a command prompt:

attrib +h +r +s C:\boot.ini

2. Windows Vista and 7

Windows Vista and 7 use the bcdedit command line tool to configure the boot menu. Start a command prompt with administrator privileges and run the following commands:

bcdedit /set {current} debug yes
bcdedit /set {current} debugtype serial
bcdedit /set {current} debugport 2
bcdedit /set {current} baudrate 115200

Set the operating system selection menu to be displayed when booting and loading the operating system.

bcdedit /set {bootmgr} displaybootmenu yes

You can reduce boot timeout as follows:

bcdedit /timeout 10

To view the current configuration, run:

bcdedit

Sample driver code

Depending on your debugging scenario, log in to your development machine: the host (the physical computer) or the virtual machine. You will write the necessary files to create a do-nothing sample driver called BriolidzSampDrv.sys. This driver has minimal DriverEntry and DriverUnload routines and will write some debug message.

In the working folder, create a file called BriolidzSampDrv.c containing the following source code:

#include <wdm.h>
 
void DriverUnload(PDRIVER_OBJECT pDriverObject)
{
    DbgPrint("BriolidzSampDrv: Driver unloading.\n");
}

NTSTATUS DriverEntry(PDRIVER_OBJECT DriverObject, PUNICODE_STRING RegistryPath)
{
    DriverObject->DriverUnload = DriverUnload;
	
    DbgPrint("BriolidzSampDrv: DriverEntry.\n");
	
    return STATUS_SUCCESS;
}

There are two additional files required to build a device driver: sources and makefile.

Create sources file containing the following lines:

TARGETNAME=BriolidzSampDrv
TARGETTYPE=DRIVER
SOURCES=BriolidzSampDrv.c

The makefile file only needs to contain this line:

!INCLUDE $(NTMAKEENV)\makefile.def

To install the sample driver, you will use a basic method based on a registry file. Create InstallSampDrv.reg file containing the following lines:

Windows Registry Editor Version 5.00
  
[HKEY_LOCAL_MACHINE\SYSTEM\CurrentControlSet\Services\BriolidzSampDrv]
"Type"=dword:00000001
"Start"=dword:00000000
"ErrorControl"=dword:00000001
"Group"="Base"
"ImagePath"="\\SystemRoot\\System32\\Drivers\\BriolidzSampDrv.sys"
"Description"="Briolidz - Sample Driver"
"DisplayName"="BriolidzSampDrv"

Building the sample driver

Download the Windows Driver Kit. Run the installer and make sure to select at least Build Environments and Debugging Tools for Windows. This will install WinDbg and the necessary environments to build drivers.

When writing this tutorial, I used WDK version is 7.1.0 which include WinDbg version 6.12.2.633. Under Windows 7 professional 64-bit, the default installation folder is C:\WinDDK\7600.16385.1 and the WDk’s start menu group is called Windows Driver Kits. WinDbg is installed in C:\WinDDK\7600.16385.1\Debuggers folder. In case you are using a different WDK version, you will just have to update paths in the following sections.

From the Windows Driver Kits start menu group, launch the command-line build environment for the desired target platform and architecture. Since The BriolidzSampDrv sample driver does not use platform specific code, you can safely use the x86 Checked Build Environment and x64 Checked Build Environment under Winows 7 submenu.

For both target platforms, open the command-line build environment, change to the working directory containing the sample driver source code and enter the command:

C:\Briolidz\Dev\BriolidzSampDrv> build

The 64-bit driver is built in C:\Briolidz\Dev\BriolidzSampDrv\objchk_win7_amd64\amd64\BriolidzSampDrv.sys and the 32-bit driver is built in C:\Briolidz\Dev\BriolidzSampDrv\objchk_win7_x86\i386\BriolidzSampDrv.sys.

Sample driver installation

Reboot the guest virtual machine to debug. When the boot menu is displayed, always choose the menu item containing [debugger enabled].

If you are planning to debug the x64 driver version on Windows Vista/7 (necessarily x64), then press F8 key and select Disable Driver Signature Enforcement from the menu. This operation must be done at every boot because 64-bit Windows systems will not allow drivers to be loaded unless they have a valid digital signature.

If you cannot digitally sign your driver, you can test-sign it and enable the TESTSIGNING mode using the bcdedit command to avoid manually disabling driver signature procedure at every boot time.

After logging in a session with administrator privileges, copy the BriolidzSampDrv.sys (from your working folder) to C:\Windows\System32\drivers. Also copy the InstallSampDrv.reg file to a location of your choice then double-click it to install the driver.

Changes will take effect after the next reboot.

Attaching WinDBG Debugger

At this point your debugging platform is ready to be used. These are the main steps to follow:

1. The WinDbg command line gives you the ability to use environment variables in order to create workspaces that contain your custom debugging settings.

In the following, if you are debugging the 32-bit driver then replace C:\Briolidz\Dev\BriolidzSampDrv\objchk_win7_amd64\amd64 with C:\Briolidz\Dev\BriolidzSampDrv\objchk_win7_x86\i386.

Inside the development machine (host or virtual machine), open a command prompt and type:

set _NT_EXECUTABLE_IMAGE_PATH= C:\Briolidz\Dev\BriolidzSampDrv\objchk_win7_amd64\amd64
set _NT_SOURCE_PATH=C:\Briolidz\Dev\BriolidzSampDrv

If you chose to debug a virtual machine from your host (physical computer):

"C:\WinDDK\7600.16385.1\Debuggers\windbg.exe" -b -k com:pipe,port=\\.\pipe\BriolidzDbgPipe,resets=0,reconnect

Otherwise:

"C:\WinDDK\7600.16385.1\Debuggers\windbg.exe" -b -k com:port=com2,resets=0,reconnect

WinDbg GUI will popup and display Waiting to reconnect message.

2. Start the target virtual machine.

3. While booting, WinDbg will halt the target system. In the WinDbg command pane, set a breakpoint in DriverEntry routine as follows:

bu BriolidzSampDrv!DriverEntry

By default, DbgPrint messages do not appear in WinDbg when the driver is running on Windows Vista/7 due to filtering reasons. You can clear this filtering using this simple call:

ed nt!Kd_DEFAULT_Mask 0x8

Press g or F5 key to continue.

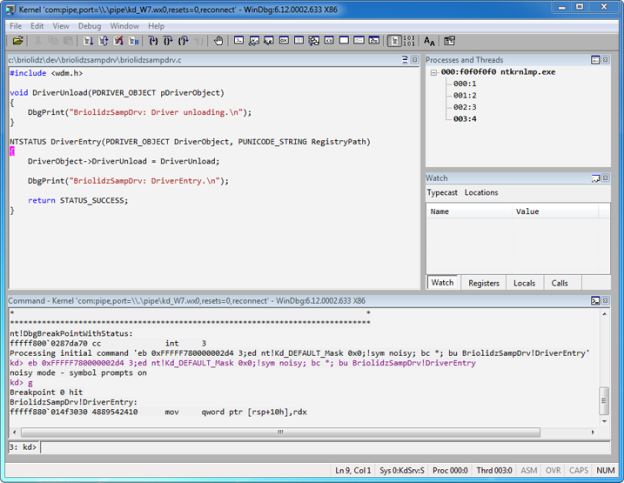
After few seconds (or more depending on your computer speed), WinDbg will halt again. You should see something similar to this screenshot.

At this level, you can debug the driver by setting other breakpoints, stepping in the code, monitoring variables and expressions.